Fabrinet (FN) Beat Guidance Again and Fell 18%. Free Cash Flow Explains Why
Fabrinet beat its own fiscal Q4 guide again and fell as much as 18% intraday, its biggest post-earnings drop yet, as free cash flow collapsed to $4.2 million from $207.3 million.
Update (August 18, 2026, 11:10am ET): The Biggest Drop of the Three, and It's the Cash Flow Statement's Fault
Fabrinet reported fiscal Q4 revenue of $1,315.8 million, up 45% year over year and above the top of its own $1.25-$1.29 billion guide. Non-GAAP EPS came in at $4.10, above the top of the $3.72-$3.87 guided range and above the $3.81 consensus, per the 8-K filed with the SEC. GAAP EPS was $3.83. Full fiscal 2026 revenue reached $4.64 billion, up 36%, with non-GAAP EPS of $14.09 for the year. The fiscal Q1 2027 guide raised the bar again: revenue of $1.375-$1.425 billion and non-GAAP EPS of $4.10-$4.25, both above what the company just delivered.
Shares had already risen 4.97% to $598.58 in Monday's regular session ahead of the print, then fell 6.94% to $557.01 after hours. That looked like the mildest of the three reactions, a net -2.32% against Friday's $570.22 close. It didn't hold. FN opened lower Tuesday and kept falling, trading as low as $484.00 and sitting at $488.63 as of 10:39am ET, down 18.37% from Monday's close, per stockanalysis.com. That is the largest one-day drop across the three post-earnings selloffs this stock has produced this year, on its biggest beat of the three. This is an intraday read, not a settled close, and the trade log below stays open until the session ends.
The gap between the mild after-hours print and the rout that followed sits in the cash flow statement. Full fiscal 2026 free cash flow was $4.2 million, down from $207.3 million a year earlier, because capital expenditures more than doubled to $252.5 million from $121.1 million, per the same 8-K. Fourth-quarter free cash flow alone was negative $36.9 million. None of that sat in the headline EPS number Monday afternoon. All of it was in the filing analysts spent Tuesday morning reading, and it is the subject of the two new sections below.
More on AI & Semiconductors: Ingenic Semiconductor IPO: HK$100 Price, 689x Demand, Aug. 25 Debut →
TL;DR
- Fabrinet beat its own fiscal Q4 guide for the third print running, then fell as much as 18.37% intraday on Tuesday, its biggest post-earnings drop yet. Revenue hit $1,315.8 million (up 45%) and non-GAAP EPS hit $4.10, both above guidance.
- Free cash flow is the real story. Full fiscal 2026 free cash flow collapsed to $4.2 million from $207.3 million, because capital expenditures more than doubled to $252.5 million. Fourth-quarter free cash flow alone was negative $36.9 million.
- The intraday move blew through the options-implied band. The chain priced roughly a 12% move; the stock delivered 18.37%, wider than the 10.22% and 8.01% drops that followed the last two beats.
- Four customers made 57.4% of fiscal 2026 revenue: Cisco at 19.9%, Nvidia at 16.3%, Nokia at 10.7% and Amazon at 10.5%, per the 10-K.
- The growth is real and lopsided. Telecom hit a record $628 million, up 55%, last quarter and datacenter interconnect rose 90% to $197 million. Datacom grew 4% and fell sequentially, held back by shortages of lasers, memory and ASICs.
The Board
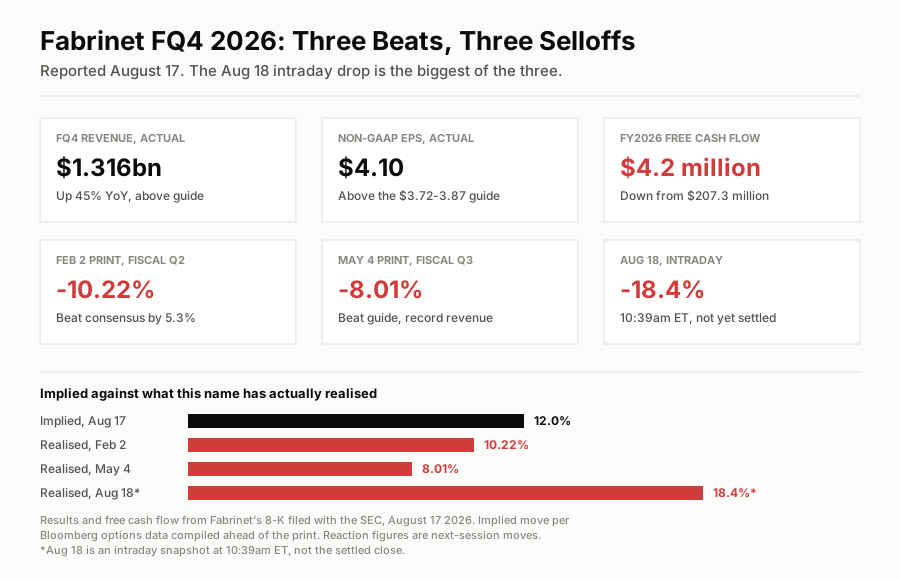
What the options chain asked for, against what all three prints have actually produced.
What Time Does Fabrinet Report Earnings?
Fabrinet releases fiscal Q4 and full-year 2026 results after the close on Monday, August 17, with the conference call at 5:00pm ET, per the company's own earnings advisory. The quarter ended June 26, 2026. It is the first name of any size on the week's calendar, which the week-ahead hub has in full alongside the retailers and the FOMC minutes.
Fabrinet builds optical components for other people's brands: transceivers, lasers and the datacenter interconnect hardware that moves traffic between buildings. That makes it an early, unglamorous read on AI infrastructure spending, nine days before Nvidia reports on August 26.
Down 10.22%. Down 8.01%. Now Down 18.4%
The first two followed record quarters that cleared guidance. In February, fiscal Q2 revenue came in at $1,132.9 million, up 35.9%, with non-GAAP EPS of $3.36 beating consensus by 5.33%. The stock fell 10.22% the next session. On May 4, fiscal Q3 revenue hit $1,214.3 million, up 39.3% year over year, non-GAAP EPS of $3.72 cleared consensus by $0.14, and the stock fell 8.01%. Both times, the guide that came with the beat was the actual event, landing on a share price that had already paid for the good outcome.
August 17 followed the same script at a bigger scale. The fiscal Q1 2027 guide came in above the quarter just delivered, a stronger signal than either of the first two prints sent, and the stock still fell further than either of them. The guide wasn't the only new information in the release this time. The cash flow statement was.
That beat-then-sell pattern is not confined to this ticker. Coherent reported on August 12 with non-GAAP EPS of $1.74, above the top of its own $1.52-$1.72 range, and guided fiscal Q1 revenue to $2.2-$2.4 billion. Shares traded down 3.55% after hours. Three optical prints in a row, three beats, three negative reactions, and Fabrinet's is now the largest of the three by a wide margin.
Where the Growth Actually Is
Last quarter's $1,214.3 million split unevenly. Telecom did $628 million, a record, up 55% year over year. Datacenter interconnect did $197 million, up 90% year over year and 38% sequentially, which management called staggering on the call and is the fastest-growing line in the business.
Datacom is the laggard, at $260 million, up 4% year over year and down 6% sequentially. Management said demand during the quarter far exceeded what it could ship, blaming shortages of lasers, memory and ASICs. That is a supply problem rather than a demand problem, and it connects directly to the memory shortage this site has been tracking all summer.
Two 800G datacom transceiver programs with a hyperscale customer were qualified last quarter, with the initial ramp starting in the quarter being reported Monday. Whether that ramp landed on schedule is the single most useful thing the call can tell anyone.
$207 Million to $4 Million
That is what full fiscal 2026 free cash flow did, year over year, per the 8-K. The cause is not weaker earnings: non-GAAP operating margin actually improved, to 10.8% for the year from 10.5% in fiscal 2025. The cause is capital expenditure, which more than doubled to $252.5 million from $121.1 million as Fabrinet builds out manufacturing capacity in Thailand. A Thai subsidiary drew a new $75.0 million term loan and expanded its credit facility to $78.3 million plus a further $100.0 million tranche during the year, with proceeds going toward that capex, per the same filing. Some of this build-out now runs through new debt alongside operating cash.
Gross margin moved the other way at the same time: non-GAAP gross margin was 12.2% in the fiscal fourth quarter, down 30 basis points from 12.5% a year earlier. So the company spent Tuesday's session explaining a beat while the two numbers that measure whether the beat is worth anything (what the business keeps per dollar of sales, and what's left over after building the next round of capacity) both moved against it.
Neither of those facts settles whether this is bullish or not, and I don't think there is a settled answer yet. The bull case is that this is exactly what capacity investment ahead of demand looks like on a cash flow statement: datacenter interconnect grew 90% last quarter and management said it couldn't ship everything customers wanted because of laser, memory and ASIC shortages, so more capacity is the correct response to a real constraint. The bear case is that a company already running near guidance every quarter is now funding its growth partly with borrowed money while its core gross margin compresses, and that combination gets less forgiving if the ramp slips even one quarter.
Is the Concentration a Problem Yet?
Not on its own, but it explains why a market already nervous about the capex chose to punish this print instead of shrugging off the guide. Four customers made 57.4% of Fabrinet's fiscal 2026 revenue, per the 10-K: Cisco at 19.9%, Nvidia at 16.3%, Nokia at 10.7% and Amazon at 10.5%. That concentration is not new and it is not a secret, but it changes what the new debt means. A manufacturer funding a capacity build with a term loan against four customers who could each individually move the growth rate is a different risk than the same build funded by a business with a thousand small accounts. Nothing in Tuesday's release says any of the four is pulling back. This capex bet stands or falls on those four customers staying roughly where they are.
27 Times Forward Earnings, Down From 35
Fabrinet's forward P/E was 34.7 on Friday's $570.22 close and a $20.4 billion market cap. At $488.63 and 18.37% lower, it's 27.05 on a market cap of roughly $17.5 billion, per stockanalysis.com. That is a meaningfully cheaper stock for a business that just delivered 45% revenue growth and raised its own guide.
Needham's Ryan Koontz kept a Buy on July 22 while cutting his target from $800 to $650; Barclays' Tim Long raised his to $702 on May 6 with an Overweight. Both are sell-side targets rather than this site's, both predate Tuesday's print, and neither carries a stated horizon beyond the usual twelve months.
I think the multiple compression is a fair, if blunt, instrument for pricing in the free cash flow question above. I don't think it's a fair instrument for pricing in the growth, which is still real and still accelerating in the two segments that matter most. Those two views point in opposite directions on the stock, which is why the trade log below keeps a pass on carrying Tuesday's event and a separate, still-pending long on owning the business once the event has repriced it.
The Options Angle
The specific thing worth pricing here was the gap between what the chain was asking and what this name had recently done. About 12% of spot was roughly $68 on a $570.22 share, needing a settle outside $501.79 or $638.65 to pay. February produced 10.22% and May produced 8.01%, both inside that band. Row 1 below passed on the straddle for that reason.
Tuesday's intraday move broke the pattern the pass was built on. At $488.63, FN sits below the $501.79 downside breakeven, meaning a straddle buyer at this price would currently be ahead. I was wrong to write, before the print, that "implied has beaten realised twice running" for this name specifically; a third data point now says the opposite, at least on the low side. I'm not reversing the call after the fact: the row stays marked Pass and grades against Tuesday's settled close, which could still land back inside the band by 4pm. But the calibration lesson this site took from July, that implied volatility looking rich has repeatedly been the wrong reason to avoid buying it, applies here too, and I said it didn't.
Trade log
| # | Stance | Structure | Strikes and expiry | Cost or credit | Spot at writing | Implied move | Conviction | Breakeven |
|---|---|---|---|---|---|---|---|---|
| 1 | Pass | Long straddle | At-the-money, Aug 21 weekly | ~12% of spot, no live quote sourced | $570.22 | ±12.0% | 6/10 | needs a settle below $501.79 or above $638.65 |
| 2 | Pass | Long common through the print | n/a, shares | n/a | $570.22 | ±12.0% | 7/10 | FN holding $570.22 into August 18 |
| 3 | Bullish, pending | Long common entered after the reaction | n/a, 12-month horizon | no entry until the print clears | $570.22 | ±12.0% | 5/10 | entry struck on the August 18 close |
As of 10:39am ET on August 18, FN traded at $488.63, outside the straddle's breakeven and well below the $570.22 the pass on holding shares was struck against. Neither row is graded yet. Row 3's entry still waits for Tuesday's close, and at the current intraday level that entry would strike more than 14% below the pre-earnings anchor. Row 3 is deliberately opposed to row 2 and scored over a different window: the pass is on carrying the event, the long is on owning the business once the event has repriced it. Every row above is logged in the Track Record ledger and will be graded against the settled close rather than the first intraday tick.
The One-Line Read
Fabrinet beat its own guide for the third straight quarter and had its worst reaction of the three. Free cash flow near zero and a debt-funded capacity build explain why; the growth itself is still real.
Next up:GDP, Wednesday at 8:30am ET →
More on AI & Semiconductors
Updated Every Saturday
The Week Ahead
Every earnings date, Fed event and setup for the current trading week, on one page.
Refreshed Weekly
Earnings Calendar
Who reports next, when, and what consensus and the whisper expect.
The Week-Ahead Brief
Don’t miss next week’s setups. Get the Saturday brief.
Latest issue, Aug 17“The consumer cracked on Friday. Six retailers answer for it this week.”
Every Saturday: next week’s earnings dates, Fed days and the trades worth watching, from the same desk that writes the week-ahead hub. Free, built for retail investors.