Waiting for a Fed Rate Cut in 2026? The Dot Plot Says You're Getting a Hike
Markets price just 21% odds of any Fed rate cut in 2026, and nine FOMC members want a hike. What the July 28-29 Fed meeting means for stocks, bonds, and your portfolio.
UPDATE (July 28, 2026): the meeting is here. The FOMC is meeting today and tomorrow, with the decision at 2:00pm ET Wednesday, July 29 and Chair Warsh's press conference at 2:30pm ET. Everything below still stands: the Fed held at 3.50-3.75% on June 17 in a unanimous vote, and the June dot plot flipped hawkish with nine members projecting at least one hike, eight holding and one cut, lifting the median year-end 2026 projection to 3.8%. One thing has moved in the doves' favour since publication: crude collapsed from $102 to the mid-$80s after the US and Iran paused strikes, weakening the energy-driven inflation impulse that built the hike case. For the hour-by-hour timetable see the Fed day guide; for how each outcome trades, see the scenario map.
TL;DR
- Everyone googling "when will the Fed cut rates" is asking the wrong question. Markets price a 21% chance of ANY cut in all of 2026.
- The June dot plot: 9 FOMC members want at least one hike, 8 want to hold, and exactly one wants a cut.
- The July 28-29 meeting is a lock to hold at 3.50-3.75% (85%+ odds). The live fight is September, where markets put 58% odds on a HIKE.
- Position for higher-for-longer, or higher-period. The cut trade is dead for this year and half the market still hasn't updated.
More on $TLT: 20-Year Bond Auction Aug 19: The 5.245% Record Line, an Hour Before the Fed Minutes →
The Question Everyone's Asking, Answered Badly Everywhere Else
Search interest in "Fed rate cut" spikes before every FOMC meeting, and every time, a wall of content tells people a cut is right around the corner. Here's what the actual data says.
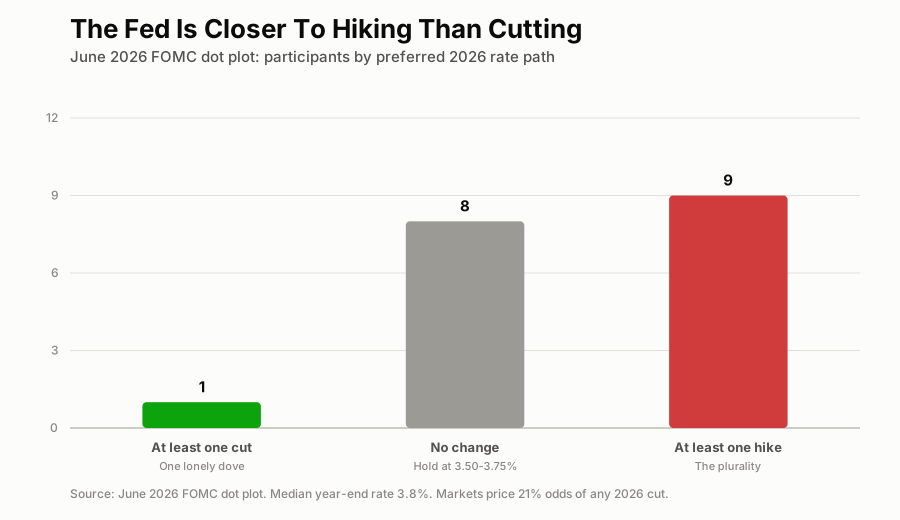
The June dot plot. The single largest bloc at the Fed wants rates HIGHER.
The June meeting raised the median year-end 2026 projection to 3.8%, above the current 3.50-3.75% range. Read that twice. The Fed's own median forecast implies the next move is up. The war-driven energy shock is feeding inflation at the exact moment the Fed hoped to declare victory, and the committee has responded by drifting hawkish all year.
What July 28-29 Actually Decides
Nothing, on rates. The hold is priced above 85% and Warsh surprising against that is a non-event in either direction. What matters is the language. The June CPI print lands July 14, two weeks before the meeting. Hot CPI plus hawkish statement language turns September's 58% hike odds into 80%, and THAT repricing is the tradeable event, because a real chunk of the equity market is still positioned like cuts are coming.
Who Gets Hurt If The Hike Lands
- Long-duration everything. Growth stocks priced on 2030 earnings, unprofitable tech, and long bonds all get discounted harder.
- Crypto first. Bitcoin already fell from $93k to a 21-month low, and trades near $65k as the market's highest-beta rate asset. A confirmed hike cycle extends that bleed.
- Gold, surprisingly. Rising real yields are gold's kryptonite, and hike odds are a big reason it's down about 28% from January's record.
- Housing stays frozen. Mortgage rates parked in the mid-6s all year with no cut relief coming.
Who wins: banks (report July 14, conveniently), insurers, and anyone sitting in T-bills getting paid 3.7% to wait.
The Options Angle
The cleanest expression is long bonds, where the market still hasn't fully priced the hawkish tail.
- Buy TLT puts three to six months out, at the money. If September delivers the hike and the dot plot's 3.8% median holds, long-end yields grind up and TLT grinds down. Defined risk, direct exposure to the actual thesis.
- Sell call spreads on TLT above the recent range if you'd rather collect than pay. Same view, positive carry.
- On equities, keep index exposure but rotate the mix toward financials into July 14 earnings. XLF benefits from the exact scenario that hurts everything else, and the market hands you a catalyst two weeks before the Fed does.
So When DO Rates Come Down?
2027, on current evidence, and only if the war-driven energy shock stops feeding inflation first. The Fed told you its answer in the dots: one member out of eighteen wants a cut this year. Stop trading the hope. Trade the committee you actually have, not the one CNBC keeps promising you.
Update, July 29, 2026: this held up. The Fed held at 3.50% to 3.75% on a 9-3 vote, and the three dissents were all to hike, not to cut. The 30-year then pushed above 5.19%. The next real test is the July jobs report on August 7, which now outranks any inflation print.
Next up:GDP, Wednesday at 8:30am ET →
More on $TLT
Updated Every Saturday
The Week Ahead
Every earnings date, Fed event and setup for the current trading week, on one page.
Refreshed Weekly
Earnings Calendar
Who reports next, when, and what consensus and the whisper expect.
The Week-Ahead Brief
Don’t miss next week’s setups. Get the Saturday brief.
Latest issue, Aug 17“The consumer cracked on Friday. Six retailers answer for it this week.”
Every Saturday: next week’s earnings dates, Fed days and the trades worth watching, from the same desk that writes the week-ahead hub. Free, built for retail investors.