Barrick Earnings Preview (August 10): More Ounces Guided, Lower Earnings Expected. Why?
Barrick reports Q2 2026 on August 10 at 6:00am ET. Consensus wants $0.84 of adjusted EPS against Q1's $0.98, even though the company guided 730,000-770,000 ounces against 719,000 produced.
TL;DR
- Updated August 10, at the close: the mines delivered, the gold price did not, and free cash flow fell off a cliff. Barrick produced 796,000 ounces, above the 730,000-770,000 guide and up 11% sequentially. Adjusted EPS was $0.82, two cents under the $0.84 consensus this piece quoted. The problem is underneath: attributable free cash flow was $141 million, down 88% from Q1's $1.21 billion and down 33% from a year ago. The stock closed at $40.88, down 6.41% from Friday's $43.68, a deeper close than the 5.88% the pre-market tape showed this morning.
- The thesis in this preview was right about the cause and wrong about the conclusion. I said consensus was marking a lower realised gold price and honouring the cost guide. Both happened: the realised price fell to $4,417 from $4,823, and all-in sustaining costs rose to $1,866 from $1,708. I then called the bar "low" on the assumption the realised price would land near Q1's. It did not, so the bar was not cleared. Working below.
- Barrick reports Q2 2026 on Monday, August 10 at 6:00am ET, with the webcast and analyst Q&A at 11:00am ET, a gap that gives the tape five hours to trade the release before management explains it.
- Consensus wants adjusted EPS of $0.84 on revenue of about $5.08 billion, from 15 analysts spread $0.75 to $0.97.
- That consensus is 14 cents below the $0.98 adjusted EPS Barrick printed in Q1, even though the company guided 730,000-770,000 ounces for Q2 against the 719,000 it produced in Q1. More ounces, lower expected earnings.
- Q1 was the blowout: production beat the 640,000-680,000 guide, the realised gold price was $4,823 an ounce, adjusted EPS rose 180%, and attributable free cash flow rose 195% to $1.21 billion.
- Options price a 5.9% move against Friday's $43.68 close, one of the smallest implied moves on the week. Gold miners are priced as gold-price derivatives, not as earnings stories, and the option market agrees.
More on Commodities & Crypto: Why Is Strategy Selling Bitcoin? It Sold 6x More Stock, And Now MSCI Wants MSTR Out →
When Does Barrick Report Earnings?
Monday, August 10, results at 6:00am ET and the webcast at 11:00am ET. The full week, including July CPI on Wednesday, is in the earnings calendar.
The Board
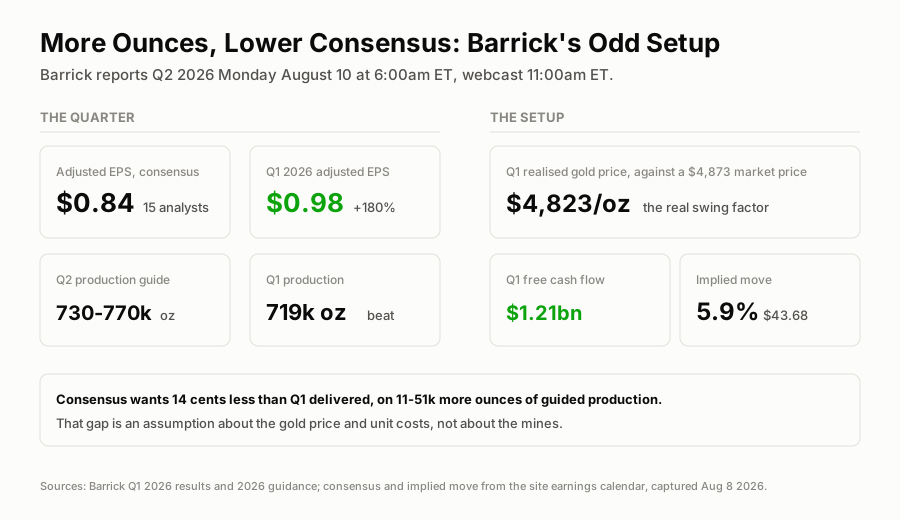
The sell side wants fewer dollars from more ounces. That is a price assumption, not an operational one.
What Landed (August 10)
| Q1 2026 | Q2 2025 | Q2 2026 actual | |
|---|---|---|---|
| Gold production | 719koz | 797koz | 796koz (guide: 730-770koz) |
| Realised gold price | $4,823/oz | $3,295/oz | $4,417/oz |
| Gold AISC | $1,708/oz | $1,684/oz | $1,866/oz |
| Adjusted EPS | $0.98 | $0.47 | $0.82 (consensus $0.84) |
| Revenue | $5.22bn | $3.68bn | $5.29bn, up 44% |
| Attributable free cash flow | $1,213m | $212m | $141m |
Production was the easy part. 796,000 ounces beat the top of the guide, on the Loulo-Gounkoto ramp running ahead of schedule, Pueblo Viejo recovering from Q1 maintenance faster than planned, and record underground tonnes at Cortez. Full-year production and cost guidance are both unchanged.
The margin per ounce is where the quarter went. Q1 earned $3,115 an ounce over all-in sustaining costs. Q2 earned $2,551, an 18% compression, because the realised price fell $406 while AISC rose $158. Multiply that against the ounces and the gold margin dollars fall about 9% even with 77,000 more ounces sold. Adjusted EPS fell 16%. Those two lines are close enough that I am comfortable saying the price and the cost guide explain essentially the whole earnings decline, which is exactly the mechanism this preview described.
The cost figure deserves one note in Barrick's favour: $1,866 sits inside the guided $1,760-1,950 band, and full-year cost guidance was left unchanged. Nothing broke. This preview made the point that the guide sat above Q1's $1,708 and therefore implied Q1 was the flattering quarter. That part held.
The $141 Million
This piece said free cash flow was the line that mattered and that Q1's $1.21 billion was the number Monday had to defend. It was not defended.
The bridge is not mysterious. Attributable operating cash flow was $1.12 billion, down from $1.97 billion in Q1. Attributable capital expenditure was $978 million, up about 30% sequentially. Subtract one from the other and you get the $141 million. Roughly two thirds of the fall is cash generation, one third is spending.
Then there is the part I find genuinely awkward. Barrick returned $1.50 billion to shareholders in the same quarter, $1.209 billion of buybacks plus the $0.175 quarterly dividend, against $141 million of attributable free cash flow. That is more than ten times what the business generated, funded from the balance sheet. Total shareholder returns were up 242% year on year.
I do not think that is reckless for one quarter, and Barrick has the balance sheet to do it. I do think it is unrepeatable at this free cash flow run rate, and management appears to agree: full-year attributable capital expenditure was cut to $3.8-4.2 billion from $4.0-4.45 billion, mostly on lower Reko Diq spending. Cutting growth capex is the lever you pull when you want the buyback to keep going.
Where This Preview Was Wrong
One line in the section below has not survived contact: "there is very little private information in a gold miner's earnings release."
The argument was that ounces are pre-guided, costs are guided, and revenue tracks a metal price anyone can look up, so the print should not move the stock. The stock moved 5.88% in pre-market, against a 5.9% implied move. Essentially the full expected range, on an earnings release.
What I underweighted is that capital allocation is not observable from outside. Production and the gold price were both public or guessable. The $978 million capex number, and therefore the free cash flow, were not. In a quarter where the metal is falling, the capex line is the swing factor, and it is the one line the market cannot model from a screen.
The Gap Consensus Is Refusing To Explain
Put the two quarters next to each other and the arithmetic is odd.
Q1 2026: 719,000 ounces produced, above a 640,000-680,000 guide. Realised gold price $4,823 an ounce against a market price of $4,873. All-in sustaining costs $1,708 an ounce, total cash costs $1,327. Net EPS $0.96 (up 256%), adjusted EPS $0.98 (up 180%), attributable free cash flow $1.21 billion (up 195%).
Q2 2026, as guided and as forecast: production of 730,000-770,000 ounces, so between 11,000 and 51,000 more ounces, driven by the ramp at Loulo-Gounkoto and Goldrush plus mine sequencing across the Nevada joint venture. Consensus adjusted EPS: $0.84.
An earnings number that falls on rising volume has to come from one of two places: a lower realised price, or higher unit costs. Full-year guidance points at both being possible. Barrick has kept 2.90-3.25 million ounces for the year with AISC guided at $1,760-1,950 an ounce, which is above the $1,708 Q1 delivered. So the company's own cost guidance implies Q1's margin was the good one.
My read is that the sell side is marking to a lower realised price than Q1's $4,823 and honouring the AISC guide, and that this is a modelling convention rather than a forecast of a bad quarter. It also means the bar into Monday is low: a realised price near Q1's and costs anywhere inside guidance clears $0.84 comfortably.
Free Cash Flow Is The Line That Matters
Miners get re-rated on cash, not on EPS, because EPS carries impairments, hedges and tax noise that free cash flow does not. Q1's $1.21 billion of attributable free cash flow, up 195%, is the number that changed the argument on this stock, and it is the number Monday has to defend.
The comparison worth holding in mind is Newmont's record quarter: the gold complex has spent 2026 converting a historically high metal price into cash at a rate that neither the multiples nor the generalist positioning had priced. That works exactly as long as the metal cooperates, and that is the bear case: nothing Barrick's management does on Monday changes the fact that the next 12 months of the P&L are mostly a bet on the gold price.
Why The Implied Move Is Only 5.9%
$43.68 spot, 5.9% implied, which is about $2.58 a share of expected range. For context that is a fraction of the 23.4% the market is paying for monday.com the same morning.
That is rational. A miner's quarterly print reveals ounces and costs, both of which are pre-announced or guided within a range, against a revenue line set by a publicly quoted commodity that everybody can already see. There is very little private information in a gold miner's earnings release. The volatility in this stock arrives on gold-price days and geopolitical days, not on earnings days, which is why the interesting Barrick trades are directional on the metal rather than event-driven on the print.
The Options Angle
The structural feature here is a cheap implied move on a stock whose real risk sits outside the event.
- Buying the straddle at 5.9% is cheap in absolute terms and still a bad trade, because the catalyst that moves this stock 6% is a gold-price session, not an earnings release.
- A bullish view here belongs in long shares, which keep the gold-price exposure that is the actual thesis. Barrick's Q1 free cash flow yield and the guided sequential production ramp are the reasons to hold it into a print with a low bar.
- Writing covered calls for 5.9% of expected range collects very little and caps the metal-driven upside that is the entire reason to own a miner. That is the wrong trade in this name at this point in the cycle.
Trade log
| # | Stance | Structure | Strikes and expiry | Cost or credit | Spot at writing | Implied move | Breakeven |
|---|---|---|---|---|---|---|---|
| 1 | Bullish | Long shares into the print | n/a | n/a | $43.68, Aug 7 close | ±5.9% | Scored against the Aug 10 close |
| 2 | Pass | Long straddle | $44 straddle, Aug 14 | ~5.9% of spot; live price not sourced | $43.68, Aug 7 close | ±5.9% | Needs a move beyond $41.10 or $46.26 |
| 3 | Pass | Covered call | Aug 14 upside strikes | Not sourced | $43.68, Aug 7 close | ±5.9% | Scored on the whole position, not the leg |
Final scoring, against the August 10 close of $40.88 (down 6.41% from Friday's $43.68):
- Row 1, long shares, is a loss. Struck at $43.68, closed at $40.88, so -6.41%, worse than the 5.9% the pre-market tape showed this morning. The reasoning was that a low bar plus a production beat would carry the print. The production beat arrived and did not help, because the earnings bar was set by the gold price rather than by the mines. This is the final mark, as stated going in.
- Row 2, the pass on the straddle, is now a loss, not a scratch. The pre-market read this morning had the realised move landing almost exactly on the 5.9% implied, call it fair value. The close is 6.41%, past the $41.10 breakeven on the $44 straddle by 22 cents. A straddle buyer is ahead of the premium paid as of tonight, four trading days before the August 14 expiry, and could still move either way before then. I passed on the argument that a miner's print carries no private information, and the stock did not just meet the implied move, it broke through the wing. Running behind, not neutral.
- Row 3, the pass on covered calls, is a loss. I said writing calls capped the metal-driven upside that is the reason to own a miner. On a stock that fell 6.41%, the premium would have cushioned the position. Scored on the whole position, that beats holding shares naked.
The instructive row is the second one. I passed on the straddle because I argued a miner's print carries no surprise, and the stock did not just move the full implied amount, it moved past it. Wrong on the argument and now trailing on the trade, with four sessions left for the straddle to prove otherwise.
The One-Line Read
Consensus is asking Barrick to earn 14 cents less on up to 51,000 more ounces, which is a statement about the gold price and the cost guide rather than about the mines, and it leaves Monday's bar low enough that the real question is whether the $1.21 billion free cash flow run rate held.
Updated August 10. It did not hold. Barrick beat its production guide, missed on earnings by two cents, and generated $141 million of attributable free cash flow against $1.21 billion three months earlier, while handing shareholders $1.50 billion. The mines worked. The gold price fell, costs rose to meet the guide, and capex took what was left. That is what owning a miner is: the operations are the part management controls and the smaller part of the answer.
Next up:GDP, Wednesday at 8:30am ET →
More on Commodities & Crypto
Updated Every Saturday
The Week Ahead
Every earnings date, Fed event and setup for the current trading week, on one page.
Refreshed Weekly
Earnings Calendar
Who reports next, when, and what consensus and the whisper expect.
The Week-Ahead Brief
Don’t miss next week’s setups. Get the Saturday brief.
Latest issue, Aug 17“The consumer cracked on Friday. Six retailers answer for it this week.”
Every Saturday: next week’s earnings dates, Fed days and the trades worth watching, from the same desk that writes the week-ahead hub. Free, built for retail investors.